
Last modified on 18 April 2012.
Literature Reference:
Wu J.C., Gardner D.P., Ozer S., Gutell R.R., and Ren P. (2009).
Correlation of RNA Secondary Structure Statistics with Thermodynamic Stability and Applications to Folding.
Journal of Molecular Biology, 391:769-783.
Manuscript Figures and Tables:
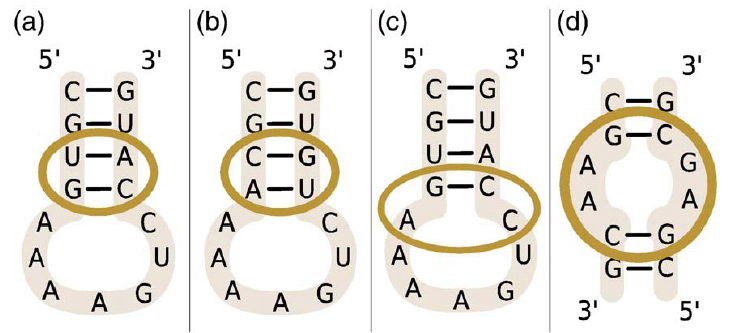
Figure 1. Illustrations of four secondary structures.
|
PNG |
Figure 2.
|
PNG |
Figure 3.
|
PNG |
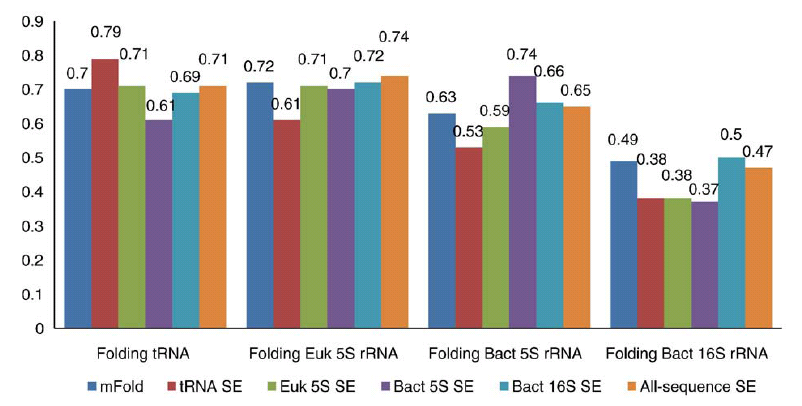
| Figure 4. Each group of bars represents folding accuracy of (from left to right) tRNA, eukaryotic 5 S rRNA, bacterial 5 S rRNA, and bacterial 16 S rRNA. Within each group, each bar represents (from left to right) unmodified Mfold, base-pair stack SE derived using tRNA, eukaryotic 5 S rRNA, bacterial 5 S rRNA, bacterial 16 S rRNA, and all-sequence dataset. | PNG |
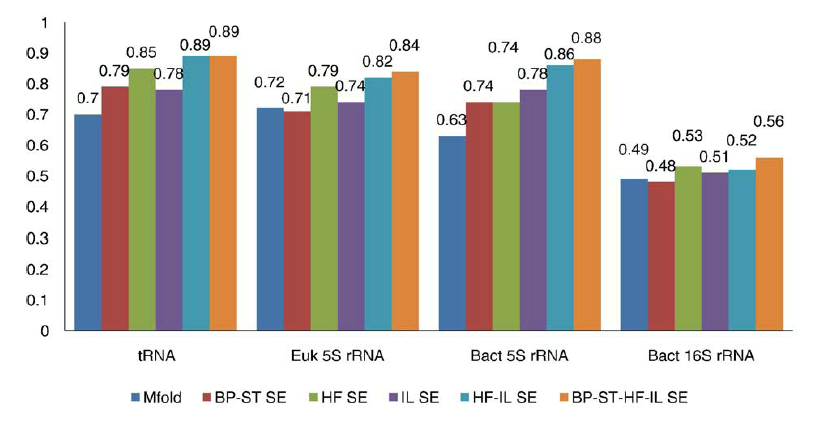
| Figure 5. Each group of bars represents the folding accuracy of (from left to right) tRNA, eukaryotic 5 S rRNA, bacterial 5 S rRNA, and bacterial 16 S rRNA.Within each group, each bar represents (from left to right) unmodified Mfold, base-pair stack SE, hairpin flank SE, internal loop SE, and all available SE (base-pair stack, hairpin flank, and internal loops). | PNG |
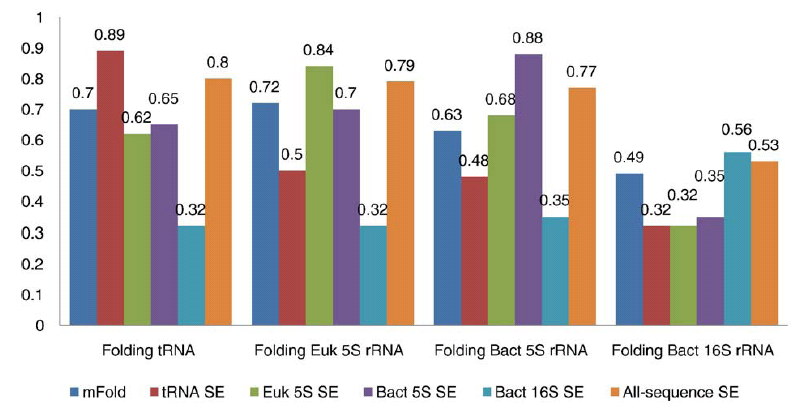
| Figure 6. Each group of bars represents folding accuracy of (from left to right) tRNA, eukaryotic 5 S rRNA, bacterial 5 S rRNA, and bacterial 16 S rRNA. Within each group, each bar represents (from left to right) unmodified Mfold, base-pair stack, hairpin flank, and internal loop SEs derived using tRNA, eukaryotic 5 S rRNA, bacterial 5 S rRNA, bacterial 16 S rRNA, and all-sequence dataset. | PNG |
| Table 1. Statistical energy derived from sequences of each specified molecule. | HTML |
| Table 2. Base-pair stack statistics. | HTML |