Last modified on 14 January 2000.
(1995) Phylogenetic Event Counting: The ec Algorithm
The chi-square statistical methods discussed previously tabulated the pairing frequencies for a sequence alignment. While this number is informative, the number of changes which occur across an alignment can also provide comparative support for (or against!) proposed base pairs. Concerted changes may reflect the need to maintain a certain structural or functional conformation at the position. The ec method tallies the numbers of changes and concerted changes between two positions over the course of an entire alignment and generates a score which is then used to evaluate potential interactions. The method assumes that the alignment under study is sorted phylogenetically and that all mutual changes are equivalent. Under these conditions, multiple changes between closely related sequences contribute more to the score than a few changes between distantly-related species.
The bases in a base pair may change in one of two ways over the course of an alignment:
- One base changes.
- Both bases change. (Called a mutual change or an "event.")
A hypothetical example will illustrate the utility of the ec method. Take two positions, X and Y, that interact. When X=G, Y=U; when X=A, Y=C. This arrangement of GU and AC basepairs can be distributed across the prokaryotes in two extreme hypothetical cases:
- The AC pair is present in all Archaea, while the GU pair is present in all (eu)Bacteria; thus, the mutual change from the GU to AC pair has occurred once.
- Both the GU and AC base pairs are interspersed throughout the Archaea and (eu)Bacteria phylogenetic domains; thus, many examples of mutual changes can be noted here.
The following case justifies the use of multiple algorithms for comparative sequence analysis. The mixy algorithm is unsuccessful in unambiguously identifying the tRNA base pair 53:61 from the tRNA-30 alignment; however, the ec method can resolve the ambiguity, allowing the pair to be included in secondary structure models.
When the mixy algorithm searches for correlations to position 53, positions 9 and 61 appear with identical mixy scores. When the analysis is run on position 61, positions 9 and 53 have identical scores. Base pair frequency tables help to explain this coincidence:
| True Interactions | Mixy False Positives | |
|---|---|---|
table p normal 53 61 a c g u - 53, 61| 0 97 0 3 0 61 ------+------------------ a 3 | 0 0 0 3 0 c 0 | 0 0 0 0 0 g 97 | 0 97 0 0 0 u 0 | 0 0 0 0 0 - 0 | 0 0 0 0 0 53 gc=( 29, 28.03, 96.7%) au=( 1, 0.03, 3.3%) Chi-square for table: 28.07 # sequences in calc'n: 30 |
table p normal 9 53 a c g u - 9, 53| 3 0 97 0 0 53 ------+------------------ a 70 | 0 0 70 0 0 c 3 | 3 0 0 0 0 g 27 | 0 0 27 0 0 u 0 | 0 0 0 0 0 - 0 | 0 0 0 0 0 9 ag=( 21, 20.30, 70.0%) gg=( 8, 7.73, 26.7%) ca=( 1, 0.03, 3.3%) Chi-square for table: 28.07 # sequences in calc'n: 30 |
table p normal 9 61 a c g u - 9, 61| 0 97 0 3 0 61 ------+------------------ a 70 | 0 70 0 0 0 c 3 | 0 0 0 3 0 g 27 | 0 27 0 0 0 u 0 | 0 0 0 0 0 - 0 | 0 0 0 0 0 9 ac=( 21, 20.30, 70.0%) gc=( 8, 7.73, 26.7%) cu=( 1, 0.03, 3.3%) Chi-square for table: 28.07 # sequences in calc'n: 30 |
| Mixy = 0.146 | Mixy = 0.146 | Mixy = 0.146 |
While it should be clear from the base pair frequency data that 53:61 is the correct base pair, we can also see how the mixy algorithm goes astray. The net differences between the expected and observed frequencies in the three cases prove to be identical, and the putative interactions share the same mixy score.
Since the ec algorithm is based upon phylogenetic events, it should be able to support the true interaction while negating the interactions involving position 9:
| True Interactions | Mixy False Positives | |
|---|---|---|
list p exchange 53 61 Number of exchanges: 29 gc -> gc ( 0) = 27 au -> gc ( 16) = 1 * gc -> au ( 0) = 1 * |
list p exchange 9 53 Number of exchanges: 29 ag -> ag ( 0) = 14 ag -> gg ( 2) = 6 . gg -> ag ( 12) = 5 . gg -> gg ( 0) = 2 ag -> ca ( 0) = 1 * ca -> ag ( 1) = 1 * |
list p exchange 9 61 Number of exchanges: 29 ac -> ac ( 0) = 14 ac -> gc ( 2) = 6 . gc -> ac ( 12) = 5 . gc -> gc ( 0) = 2 ac -> cu ( 0) = 1 * cu -> ac ( 1) = 1 * |
| EC = 1.000 | EC = 0.154 | EC = 0.154 |
In the case of the true base pair, 53:61, the only changes occuring are events; that is, covariations between GC and AU. In the two incorrect proposals involving position 9, single base changes predominate and provide only negative support for those interactions.
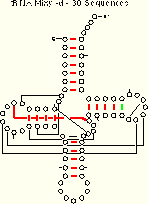
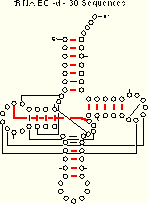
We compare the ec results (for the tRNA-30 alignment) with the mixy results:
 |
 |
| tRNA-30 Mixy -d 21 (22) of 27 Pairs Identified |
tRNA-30 EC -d 19 of 27 Pairs Identified |
| Composite Figure for this table in PostScript and PDF formats. | |
EC Figures:
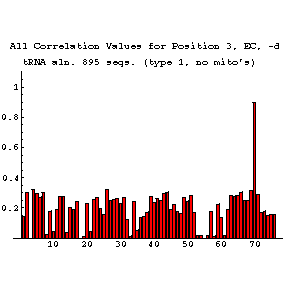
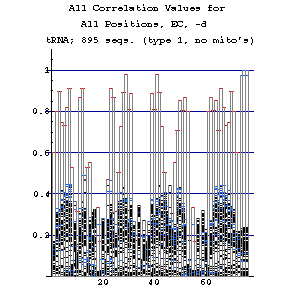
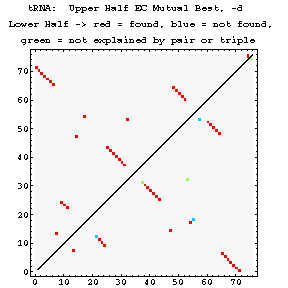
As previously done for the mixy algorithm, this series of figures shows how the ec algorithm performs on the tRNA-895 alignment. Compare and contrast these figures with those shown before; while the two algorithms both detect many of the same interactions, they also detect some differently.

