
Last modified on 14 January 2000.
(1983) The First Comparative Algorithm: Chi-Square Statistics
The first method to use a computer algorithm for detection of covariation was a chi-square approach developed by Gary Olsen (thesis, University of Colorado Health Sciences Center, 1983). The general chi-square method involves a comparison between observed and expected data. Large deviations from expected values produce large chi-square values, which indicate a correlation.
For comparative analysis, the chi-square value is calculated as:
where
- no(Mi,Nj) is the number of observations of base pair M:N at position i-j, and
- ne(Mi,Nj) is the expected number of observations for M:N at position i-j, calculated from the observed numbers of bases M and N at positions i and j (no(Mi) and no(Nj)).
When this technique was first developed, technical limitations hampered its effectiveness. Contemporary computers were slow, by modern standards, and the sequence databases were smaller than the minimal size needed to use statistical methods with confidence. As computer technology improved and the sequence databases grew, the chi-square method was refined and proved to be a useful development.
The chi-square method is not biased toward any particular pairing types; each of the 16 pairing types is treated equally. The method does not search specifically for secondary structure elements; yet, chi-square analysis predicted all of the tRNA secondary structure base pairings from about 200 tRNA sequences, and Watson-Crick pairing emerged as the most common pairing motif, independently verifying this basic principle of RNA structure. Chi-square can detect weaker interactions; this method indicated that the pairing partners in the tRNA D-helix, which were not found using the reddot-greendot approach, covary best with each other. These weaker interactions also include statistically significant constraints between all of the nucleotides within the tRNA D-helix.
The initial successes of the chi-square method led to the development of several algorithms based on chi-square statistics. One of these methods is described in detail below.
(1992-present) An Improved Statistical Method at Work: The Mutual Information (mixy) Algorithm
The limitations of the number pattern method ensured that other methods would be designed and tested. The mixy (Mutual Information between positions X and Y) algorithm is a chi-square based statistical method which yields improved results in the detection of RNA interactions. Rather than searching for an entire structural element among many possibilities, the chi-square statistical methods test for interactions occurring between two positions, which reduces the number of search possibilites to n2, where n is the number of nucleotides in the sequence under study. Like the number pattern method, mixy is not prejudiced toward Watson-Crick interactions; the algorithm will detect each of the sixteen pairing types which may appear in an analysis.
The mixy score can be calculated using this formula:
where
- fo(Mi) is the base frequency for M at position i,
- fo(Nj) is the base frequency for N at position j, and
- fo(Mi,Nj) is the base pair frequency for M:N at position i-j.
NOTE: mixy scores are calculated in practice using a more efficient method. For more details, please consult:
- Chiu D.K. and Kolodziejczak T. (1991) Inferring consensus structure from nucleic acid sequences. Comput. Appl. Biosci. 7(3):347-352.
- Gutell R.R., Power A., Hertz G., Putz E., and Stormo G. (1992) Identifying Constraints on the Higher-Order Structure of RNA: Continued Development and Application of Comparative Sequence Analysis Methods. Nucleic Acids Research 20(21):5785-5795.
Covariations are deviations from independent variation and have nonzero mixy scores. The scores are maximized when the two positions are highly variable and completely correlated. By filtering the mixy output to show only the highest-scoring positions, potential interactions of interest can be quickly recognized, reducing the amount of time spent examining potential interactions with little or no comparative support. The canonical pairings are the most often observed and tend to produce strong signals.
From a database of 200 tRNA sequences, the mixy algorithm was able to predict all of the secondary structure base pairings (in comparison to the crystal structure). Almost all pairings of these pairings contain at least two compensatory base changes with a minimal number of exceptions.
Mixy Image Section
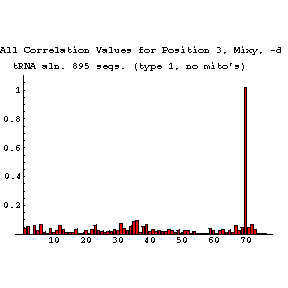
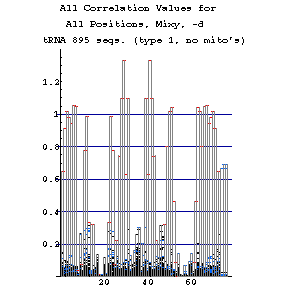
The following series of images is intended to illustrate how the mixy algorithm performs in actual use. Here, results from the correlation analysis of the tRNA-895 alignment are presented. A larger version of each image may be viewed in a separate window by selecting that image.
| Bar Graph | Histogram | Density Plot |
|---|---|---|
 |
 |
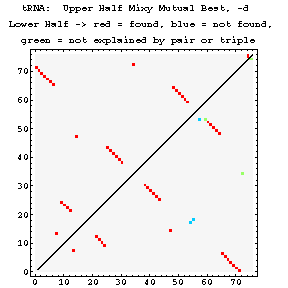 |
| This bar graph shows a clean example of strong correlation. Each position is compared with tRNA position 3, in this case, and the mixy scores are plotted. Position 70 stands out as strongly correlating, and the two positions do prove to be base-paired. All other positions have much lower correlation scores. | The histogram presentation condenses the bar graphs for every position into a single figure. Red indicates those correlations which are mutual bests, blue shows weaker correlations that are not well separated from other data points, and the weakest correlations appear in black. Note that base-paired positions typically have a single high correlation value, and that the value for each member of a pair is the same. With this in mind, it is possible to recognize elements of secondary structure from this plot. | Density plots have two parts. Above the diagonal are shown all of the "mutual best" results from the mixy algorithm. Below the diagonal, these results are compared to the known crystal structure. Interactions which are predicted correctly are shown in red. Predicted interactions which are not seen in the crystal structure are marked in green. Interactions which appear in the crystal structure and are not detected using mixy are colored blue. The mixy algorithm detects most of the known interactions in tRNA as mutual best correlates. |