
Last modified on 25 July 2000.
| Figure | Black & White | Color | Notes and Examples |
|---|---|---|---|
| Figure 1: Frequency and distribution of single nucleotides in Bacterial 16 S and 23 S rRNAs comparative structure models. | GIF, PS | GIF, PS | |
| Figure 2: Frequency and distribution of consecutive nucleotides in Bacterial 16 S and 23 S rRNAs comparative structure models. | GIF, PS | GIF, PS | |
| Figure 3: Frequency and distribution of consecutive nucleotides at loop-helix junctions in Bacterial 16 S and 23 S rRNAs comparative structure models. | GIF, PS | GIF, PS | 
|
| Figure 4: Frequency and distribution of consecutive trinucleotides at loop-helix junctions in Bacterial 16 S and 23 S rRNAs comparative structure models.
A. 3'loop-5'helix junction (85.26% of the combinations are shown.) B. 3'helix-5'loop junction (82.99% of the combinations are shown.) |
GIF (4A), GIF (4B), PS (4A and 4B) | GIF (4A), GIF (4B), PS (4A and 4B) | The underlined nucleotide is paired. |
| Figure 5: A-motifs mapped onto the Escherichia coli 16 S and 23 S Comparative Secondary Structure Models. | A. 16S rRNA: PS, PDF
B. 23S rRNA, 5' Half: PS, PDF C. 23S rRNA, 3' Half: PS, PDF |
||
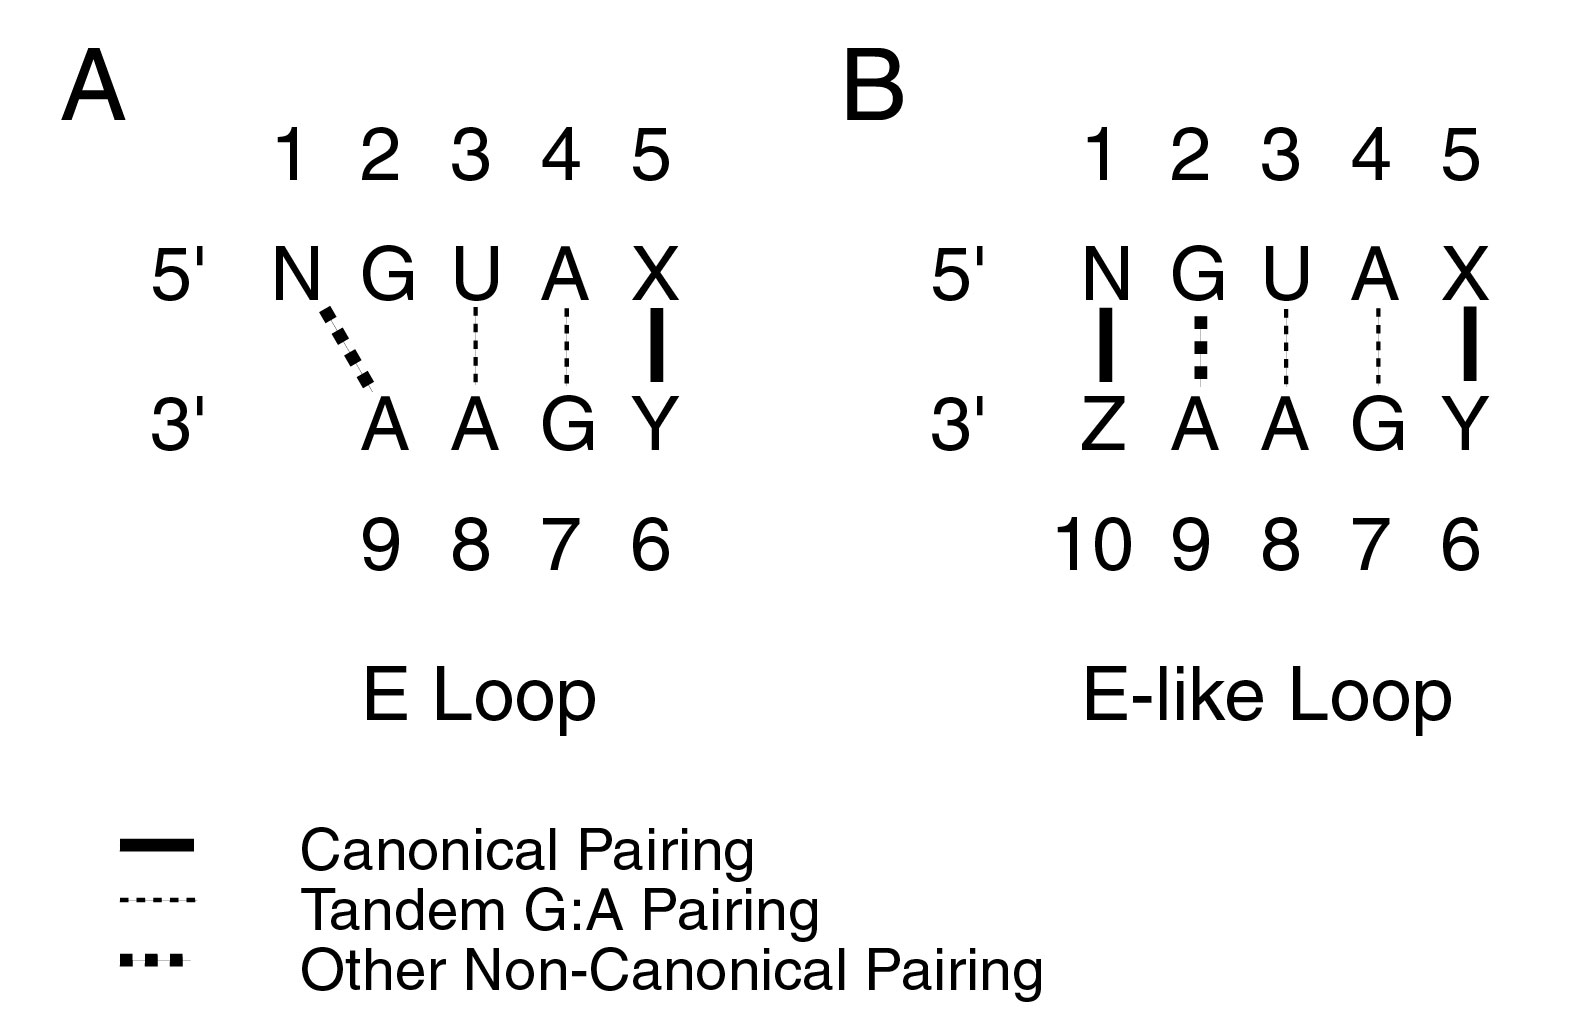
| Figure 6: Schematic of E and E-like Loops. | JPEG, PS |