Last modified on 27 November 1998.
(early 1960's-1980) In the Beginning: Brute Force Tools
Section Outline:
- visual search
- small sequence databases
- Watson-Crick, GU pairings
- secondary structure helix context
- two changes confirms helix
- validated by tRNA crystal structure
The prediction of RNA secondary and tertiary structure with comparative methods has progressed as the number of sequences has increased and in parallel with the advancements in the methods of identifying positional covariation. Starting with tRNA in the early 1960's, the pioneers of comparative sequence analysis searched for G:C, A:U, and G:U compensatory base changes within potential helices (references) by direct visualization of sequences and sequence alignments. This approach resulted in the tRNA cloverleaf secondary structure model, which was substantiated with the crystal structure solutions for tRNA (references).
(1978-1981) Reddot-Greendot: An Enhanced Visual Method for Two Sequences
Section Outline:
- strict covariation
- Watson-Crick and wobble pairings only (consecutive, anti-parallel, nested)
- secondary structure helix context
- comparative proof for helix: two or more compensatory base changes within that helix
- less similar sequences provide more supporting changes
- sequences aligned for maximal primary structure similarity
- can only analyze two sequences at one time...
- can only identify secondary interactions
- advantages/disadvantages
The reddot-greendot method highlights differences between two sequences to assist in the search for helices. Carl Woese's method involves first aligning two sequences to maximize their primary structure similarity. Then, colored "dots" were used to indicate any changes at a given position for the two aligned sequences. Each position falls into one of three categories:
- When the nucleotide at a given position was identical in the two sequences, no mark was made.
- When a transition occurred (a change from purine to purine or pyrimidine to pyrimidine), a red dot (shown in the following figures as a red "+") was placed.
- When a transversion occurred (a change which interconverts purines and pyrimidines), a green dot (shown in the following figures as a green "-") was placed.
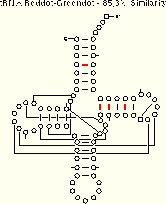
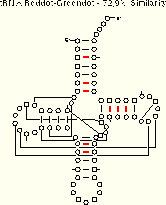
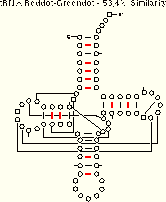
Now, we present a series of examples from tRNA showing the method in action. These three examples include five different tRNA sequences which span a range of sequence similarity from about 50% to about 90%. As you examine the examples, ask yourself how easy it is to align the sequence sets. Then, consider how many and which structural elements can be phylogenetically proven with each sequence set. Only one of the four tRNA helices (the TΨC Stem) is comparatively proven in all three examples; the other three helices are comparatively in the examples with greater sequence variation. Compare the amount of structure which can be inferred using the reddot-greendot method to the modern comparative secondary structure (PS); the helices from the modern structure are boxed on the reddot-greendot figure for easy comparison.
The base pairs with coordinated base substitutions are shown with red tick marks on these secondary structure diagrams:
A composite figure containing the above four reddot-greendot images is available in PostScript and PDF formats.
We conclude from this reddot-greendot analysis that:
- the number of base pairs predicted is dependent upon the percentage of sequence similarity between the sequences under consideration;
- only secondary structure base pairs (Watson-Crick or GU) within the context of a putative secondary structure helix can be detected; and
- tertiary interactions cannot be identified by this method.
(early 1980's) Diff: Visual Assessment of Multiple Sequences
Section Outline:
- visual method to analyze multiple sequences simultaneously
- variation necessary for covariation
- pick up similar patterns (covariations!) by eye
- reevaluate the existing structural model
- add new interactions
- remove outmoded interactions
- identify non-secondary interactions
As more sequences were determined and made available, the limitations of the reddot-greendot method became readily apparent. In order to best reevaluate and extend the existing structural model, multiple sequences must be addressed at one time. The diff method enabled multiple sequences to be considered together in a visual way, and provided an opportunity to identify non-secondary structure interactions.
The diff method redisplays an existing alignment to emphasize the differences between the sequences. One sequence is selected as a reference (for tRNA, the S. cerevisiae Phe sequence is used) and left unaltered; this sequence is placed at the top of the alignment by convention. In each other sequence, any base which is unchanged from the reference sequence is replaced with a "." Bases which are different from the reference sequence are not changed, visually highlighting the sequence variation in the alignment.
The next set of figures illustrates the diff method. The first two images are created from the tRNA-5 alignment, containing the sequences used to illustrate the reddot-greendot method. The first image shows the normal alignment, while the second has been converted to the diff view.
 |
 |
A composite figure of these two images and their associated captions is available in PostScript AND PDF formats.
The diff view is inspected for patterns of changes. Certain positions (e.g. 7:66 and 28:42) vary in a 1:1 relationship. Other positions do not vary this closely: the 13:22 base pair, which is a GU pair in one sequence and GC in the others, is not cleanly detected in this alignment. Examine the figure further to find other, similar examples.
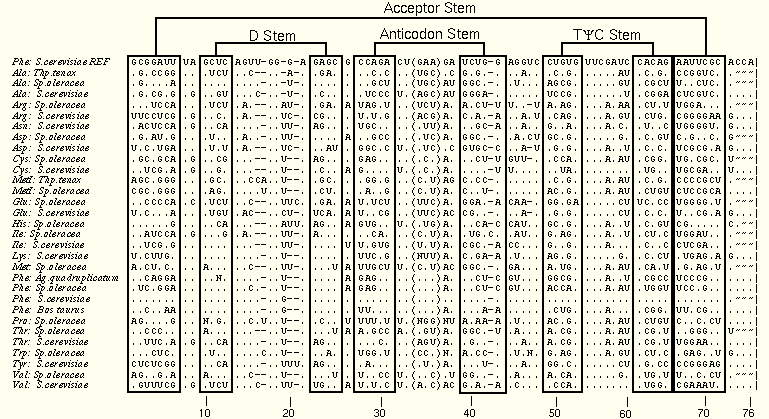
The third image is a diff view of the tRNA-30 alignment. More sequences increase the number of possible patterns of variation and provide more opportunies to detect new interactions and confirm or negate previously proposed interactions.
 |
The above figure and its caption are available in PostScript and PDF formats.
7:66 remains in a 1:1 relationship, but 28:42 now has one exception (a UG pair). The 15:48 tertiary base pair, despite a few exceptions, is recognizable here, after being invariant in the tRNA-5 alignment. The reader is encouraged to search for other examples using this larger sequence database.
The above analysis prompts the following conclusions:
- Using the diff method, the information content of multiple sequences can be addressed in a single analysis.
- The diff method can identify tertiary interactions.
- Invariant positions are not amenable to analysis with the diff method.


