
Last modified on 14 January 2000.
Back to Basics: The Covary Algorithm:
The covary algorithm measures the purity of a positional covariation. The maximum score of 1 denotes that all nucleotide substitutions or variations are associated with a concomitant variation in the same sequence(s) (i.e. covariation). Scores less than 1 signify changes at one position that are not compensated for at the other position. Thus, the larger the score, the better the correlation. The maximum number of pairing types that can have pure covariations with one another is four. Only sets of positions that are not invariant and have at least one covariation in more than 0.5% of the sequences are considered and scored.
Suppose that we suspect that two positions, I and II, are base paired, and wish to evaluate this putative interaction using the covary method. Position I is 99.5% A and 0.5% G, and Position II is 99.5% U and 0.5% C. Can covary identify this interaction?
Two possible scenarios are presented hereunder. In Case 1, the two positions covary perfectly and the interaction can be identified by covary. In Case 2, the pattern of base pairs is random, and covary will not identify an interaction:
| Position II | ||||||
| Case 1 | Case 2 | |||||
| C | U | C | U | |||
| 0.5 | 99.5 | 0.5 | 99.5 | |||
| Position I | A | 99.5 | -- | 99.5 | 0.5 | 99.0 |
| G | 0.5 | 0.5 | -- | 0.0* | 0.5 | |
The following set of figures illustrates the method. Each presents the base pair frequency table for tRNA pair 1:72 (data from the tRNA-30 alignment). The base frequencies for position 1 appear along the left of the table shaded in pink, and base frequencies for position 72 appear across the top of the table shaded in cyan. The base pair frequency values are shown in the table (gray background); the data are also listed in tabular form (observed # of base pairs, expected # of base pairs, %e of base pairs) to the right of the table, with the number of sequences considered. The expected number of base pairs is the number of base pairs that will occur if the two positions are independent and is calculated by multiplying the individual base frequencies by the number of sequences: e.g., for GC, (.67 * .60) * 30 = 12.06, or approximately 12.
| 1, 72 | a | c | g | u | - | gc=(18, 12.00, 60.0%) au=( 4, 0.80, 13.3%) ua=( 4, 0.67, 13.3%) gu=( 2, 4.00, 6.7%) ca=( 1, 0.33, 3.3%) cg=( 1, 0.07, 3.3%) # sequences used: 30 |
|
| 17 | 60 | 3 | 20 | 0 | |||
| a | 13 | 0 | 0 | 0 | 13 | 0 | |
| c | 7 | 3 | 0 | 3 | 0 | 0 | |
| g | 67 | 0 | 60 | 0 | 7 | 0 | |
| u | 13 | 13 | 0 | 0 | 0 | 0 | |
| - | 0 | 0 | 0 | 0 | 0 | 0 | |
The covary algorithm starts by selecting the most prevalent base pairing type. Here, GC (at 60%) is the most prevalent combination. It has been highlighted in gray in the table and bolded in the list at the right. Concomitantly, all pairings involving G at position 1 and C at 72 are discarded, since none of these can now be involved in a pure covariation; these are highlighted in yellow.
| 1, 72 | a | c | g | u | - | gc=(18, 12.00, 60.0%) au=( 4, 0.80, 13.3%) ua=( 4, 0.67, 13.3%) gu=( 2, 4.00, 6.7%) ca=( 1, 0.33, 3.3%) cg=( 1, 0.07, 3.3%) # sequences used: 30 |
|
| 17 | 60 | 3 | 20 | 0 | |||
| a | 13 | 0 | 0 | 0 | 13 | 0 | |
| c | 7 | 3 | 0 | 3 | 0 | 0 | |
| g | 67 | 0 | 60 | 0 | 7 | 0 | |
| u | 13 | 13 | 0 | 0 | 0 | 0 | |
| - | 0 | 0 | 0 | 0 | 0 | 0 | |
The next most prevalent pairing type is AU (at 13%). Since AU is a covariation with GC and thus has not been previously discarded, the algorithm includes AU for subsequent calculations. Again, the other pairings in the same row and column are discarded.
| 1, 72 | a | c | g | u | - | gc=(18, 12.00, 60.0%) au=( 4, 0.80, 13.3%) ua=( 4, 0.67, 13.3%) gu=( 2, 4.00, 6.7%) ca=( 1, 0.33, 3.3%) cg=( 1, 0.07, 3.3%) # sequences used: 30 |
|
| 17 | 60 | 3 | 20 | 0 | |||
| a | 13 | 0 | 0 | 0 | 13 | 0 | |
| c | 7 | 3 | 0 | 3 | 0 | 0 | |
| g | 67 | 0 | 60 | 0 | 7 | 0 | |
| u | 13 | 13 | 0 | 0 | 0 | 0 | |
| - | 0 | 0 | 0 | 0 | 0 | 0 | |
UA (at 13%) is next in the list, and is selected. Pairings in the same row and column are discarded...
| 1, 72 | a | c | g | u | - | gc=(18, 12.00, 60.0%) au=( 4, 0.80, 13.3%) ua=( 4, 0.67, 13.3%) gu=( 2, 4.00, 6.7%) ca=( 1, 0.33, 3.3%) cg=( 1, 0.07, 3.3%) # sequences used: 30 |
|
| 17 | 60 | 3 | 20 | 0 | |||
| a | 13 | 0 | 0 | 0 | 13 | 0 | |
| c | 7 | 3 | 0 | 3 | 0 | 0 | |
| g | 67 | 0 | 60 | 0 | 7 | 0 | |
| u | 13 | 13 | 0 | 0 | 0 | 0 | |
| - | 0 | 0 | 0 | 0 | 0 | 0 | |
GU (at 6.7%) is the next most frequent pairing in the list; however, GU has already been discarded since it does not covary with GC. We continue to CA (at 3.3%), which has also been discarded. The final pairing on the list is CG (at 3.3%), which does covary with the other selected pairings (GC, AU, and UA). Since CG is the final pairing from the list, the task is now done. The covary score for this base pair is the sum of the base pair frequencies for selected sequences, which in this case is 0.899.
| 1, 72 | a | c | g | u | - | gc=(18, 12.00, 60.0%) au=( 4, 0.80, 13.3%) ua=( 4, 0.67, 13.3%) gu=( 2, 4.00, 6.7%) ca=( 1, 0.33, 3.3%) cg=( 1, 0.07, 3.3%) # sequences used: 30 |
|
| 17 | 60 | 3 | 20 | 0 | |||
| a | 13 | 0 | 0 | 0 | 13 | 0 | |
| c | 7 | 3 | 0 | 3 | 0 | 0 | |
| g | 67 | 0 | 60 | 0 | 7 | 0 | |
| u | 13 | 13 | 0 | 0 | 0 | 0 | |
| - | 0 | 0 | 0 | 0 | 0 | 0 | |
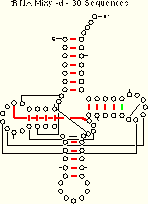
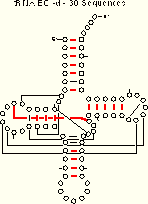
The results from the covary algorithm are compared with the corresponding mixy and ec results (data from the tRNA-30 alignment):
| tRNA-30 Mixy -d 21 (22) of 27 Pairs Identified |
tRNA-30 EC -d 19 of 27 Pairs Identified |
tRNA-30 Covary 21 (22) of 27 Pairs Identified |
|---|---|---|
 |
 |
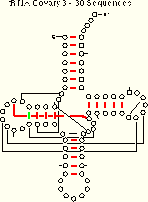 |
| Composite Figure for this table in PostScript and PDF formats. | ||
The covary algorithm performs as well or better than the mixy and ec methods. Note that both mixy and covary make one ambiguous identification, but the two algorithms do so for different base pairs. Thus, several different covariation algorithms are necessary to identify all of the known secondary and tertiary structure pairings.
Five base pairs are missed by covary in the tRNA-30 alignment. Four of these (8:14, 18:55, 19:56, and 54:58) are invariant and thus cannot be identified with covary. Comparison of the covary results for two pairs, 7:66 and 54:58, indicates why invariant positions are excluded from the covary analysis:
| 7:66 | a | c | g | u | - | au=(14, 6.53, 46.7%) gc=(11, 4.03, 36.7%) ua=( 5, 0.83, 16.7%) # sequences used: 30 |
|
| 17 | 37 | 0 | 47 | 0 | |||
| a | 47 | 0 | 0 | 0 | 47 | 0 | |
| c | 0 | 0 | 0 | 0 | 0 | 0 | |
| g | 37 | 0 | 37 | 0 | 0 | 0 | |
| u | 17 | 17 | 0 | 0 | 0 | 0 | |
| - | 0 | 0 | 0 | 0 | 0 | 0 | |
| 54:58 | a | c | g | u | - | ua=(30, 30.00, 100.0%) # sequences used: 30 |
|
| 100 | 0 | 0 | 0 | 0 | |||
| a | 0 | 0 | 0 | 0 | 0 | 0 | |
| c | 0 | 0 | 0 | 0 | 0 | 0 | |
| g | 0 | 0 | 0 | 0 | 0 | 0 | |
| u | 100 | 100 | 0 | 0 | 0 | 0 | |
| - | 0 | 0 | 0 | 0 | 0 | 0 | |
For both of these base pairs, the covary score (without discarding invariants) would be 1.000. Invariant positions, then, would prevent the unambiguous identification of correlating positions which show perfect covariation. Thus, any pairing which does not contain at least one covariation at 0.5% or greater abundance is not considered nor scored.
The other pair not identified by the covary algorithm is 26:44, which is identified as a one-way best. 26:44 is interesting because tRNAs for different amino acids show different patterns of variation; for example, in tRNA-Phe, the predominant pattern is GA <-> AG, while in tRNA-Pro, the pattern is UA <-> AG, and other tRNAs show patterns with minor components [See the tRNA Base Pair Frequency Tables in Section 3: Detailed Comparative Structure Information for RNA Molecules]. The resulting overall pattern hinders the identification of this pair.
| 26:44 | a | c | g | u | - | ga=(16, 11.90, 53.3%) aa=( 4, 7.70, 13.3%) ag=( 3, 1.47, 10.0%) ac=( 2, 1.10, 6.7%) au=( 2, 0.73, 6.7%) gg=( 1, 2.27, 3.3%) ua=( 1, 1.40, 3.3%) uc=( 1, 0.20, 3.3%) |
|
| 70 | 10 | 13 | 7 | 0 | |||
| a | 37 | 13 | 7 | 10 | 7 | 0 | |
| c | 0 | 0 | 0 | 0 | 0 | 0 | |
| g | 57 | 53 | 0 | 3 | 0 | 0 | |
| u | 7 | 3 | 3 | 0 | 0 | 0 | |
| - | 0 | 0 | 0 | 0 | 0 | 0 | |
Best covary pair with 26 26 44 0.667 30 B 26 10 0.621 29 26 16 0.600 30 26 30 0.600 30 26 32 0.600 30 26 53 0.600 30 26 61 0.600 30 |
Best covary pair with 44
   44   53 0.733   30
   44   61 0.733   30
   44   26 0.667   30 B
covary (53:61) = 1.000 |
||||||
Summary Highlights for the covary algorithm:
- Many of the known tRNA base pairs are identified.
- The algorithm cannot be applied to invariant positions.
- Basepairs that do not have a unique covariation across all sequences in the dataset (e.g. 26:44) will not be identified with this method.
WC and WCGU: Two Other "Summary" Methods:
Section Outline:
- search based on summarizing a particular pairing pattern (extensible to other patterns)
- pbest approach
- advantages/disadvantages
The WC algorithm tests for correlations between two positions which are based upon the amount of Watson-Crick pairings which form between the two positions. Since Watson-Crick pairing is the most abundant pairing type, the approach is capable of identifying many of the base pairs in a selected RNA molecule. WCGU is an extension of the WC method which additionally includes wobble pairings, the next most common type of pairing.
The WC score is the fraction of base pairs between two positions which are Watson-Crick (AU, CG, GC, or UA). The WCGU score is the fraction of base pairs between two positions which are Watson-Crick or wobble (GU and UG). In both cases, sequences containing gaps are not included in the total number of base pairings.
All seven base pairs in the acceptor stem helix of tRNA are successfully identified using both the WC and WCGU methods (data from the tRNA-30 alignment):
| Base Pair | WC Score | WCGU Score |
|---|---|---|
| 1:72 | 0.900 | 0.967 |
| 2:71 | 0.933 | 1.000 |
| 3:70 | 0.900 | 1.000 |
| 4:69 | 0.800 | 0.967 |
| 5:68 | 0.800 | 1.000 |
| 6:67 | 0.767 | 0.933 |
| 7:66 | 1.000 | 1.000 |
At first, some of these assignments appear to be ambiguous; however, the assignments are unambiguous. Complete data for the WC method for pairs 1:72 and 3:70 (shown in bold) and the non-pairs 1:70 and 3:72 illustrate this point:
| 70 | 72 | |
| 1 | gg = 23.3% + gc = 16.7% ga = 13.3% gu = 13.3% ug = 13.3% ac = 6.7% ag = 6.7% + cg = 6.7% |
+ gc = 60.0% + au = 13.3% + ua = 13.3% gu = 6.7% ca = 3.3% + cg = 3.3% |
| WC = 0.234 | WC = 0.900 | |
| 3 | + cg = 50.0% + gc = 23.3% + ua = 13.3% gu = 10.0% + au = 3.3% |
+ gc = 23.3% cc = 20.0% ca = 16.7% uc = 13.3% cu = 10.0% gu = 10.0% ac = 3.3% + cg = 3.3% |
| WC = 0.900 | WC = 0.266 |
The two base pairs do produce the same total score, but the compositions of the base pairs themselves are different, and the individual scores are the result of two unique combinations.
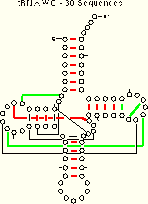
Compare the results from these two algorithms to those of the mixy algorithm for the tRNA-30 alignment:
|
 |
 |
| tRNA-30 Mixy -d 21 (22) of 27 Pairs Identified |
tRNA-30 WC 19 (23) of 27 Pairs Identified |
tRNA-30 WCGU 18 (24) of 27 Pairs Identified |
| Composite Figure for this table in PostScript and PDF formats. | ||
While fewer base pairs are unambiguously identified using the WC and WCGU methods, the number of base pairs which are potentially identified increases.
Some of these ambiguous identifications are the result of including invariant positions in the calculations, which can occlude positive results with both methods by producing identical scores. The WC method also works poorly when a significant amount of GU pairing occurs, diluting its signal. Of course, this latter case is easily identified using the WCGU method.
Nine of the 27 base pairs in tRNA are not unambiguously identified using one or both of these two methods on the tRNA-30 alignment. Many of the identification problems are caused by invariant positions. The following examples show some of these cases:
- 8:14 (100% UA). Neither method can identify this pair unambiguously due to the presence of other positions with invariant U (three) and A (three).
- 10:25 (86% GC, 10% AU, 4% GU). WC fails to unambiguously identify this pairing because position 10 correlates with positions 74 and 75, which are invariant C in those sequences having nucleotides at those positions. Position 25 correlates cleanly with position 10. Invariant positions cause WCGU to fail for positions 10 and 25.
- 15:48 (80% GC, 13% AU, and 7% AC). The WC method identifies this pair unambiguously. The WCGU method shows higher correlations with positions having invariant U (four positions) for position 15 and having invariant G (two positions) for position 48.
- 26:44 (7% AU, 3% UA). Other positions have stronger correlations to both positions 26 and 44 in both methods because the base pair contains few Watson-Crick and no wobble pairing combinations.
The WC and WCGU criteria:
- identify many base pairs correctly;
- identify (with ambiguity) pairs which no other methods identify;
- do not identify pairs which contain high levels of non-canonical pairing;
- cannot identify base pair without ambiguity when invariant positions correlate to variable positions.
Next Section: Collective Scoring.